Purpose: We are going to build a SQL query to perform Anova to determine if there is a significant difference of mean across different groups.
Data:
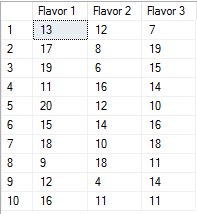
Randomly find 30 people, divide them into three group to taste three different flavor of product and then collect their feedback in the form of score. The data is stored in [ANOVA].[Flavor].
We would like to test if there is a significant difference of mean across different groups via ANOVA.
Null Hypothesis: H0: μ1 = μ2 = μ3

Data:
Randomly find 30 people, divide them into three group to taste three different flavor of product and then collect their feedback in the form of score. The data is stored in [ANOVA].[Flavor].
We would like to test if there is a significant difference of mean across different groups via ANOVA.
Null Hypothesis: H0: μ1 = μ2 = μ3
Before we start to run the analysis, we transform the data a little bit to be like this.
select
*
into [ANOVA].[Flavor_Unpivot]
from
(
SELECT 'Flavor1' as Flavor, [Flavor 1] as value  FROM [ANOVA].[Flavor]
union all
SELECT 'Flavor2' as Flavor, [Flavor 2] as value  FROM [ANOVA].[Flavor]
union all
SELECT 'Flavor3' as Flavor, [Flavor 3] as value  FROM [ANOVA].[Flavor]
) A

Description: We first calculate the Count/Sum/Mean/Variance by group.

Anova - Single Factor:

Interpretation: If the data is collected independently, normal-distributed, then
 The F critical ratio we calculate is 2.5146.
The F for alpha 0.05 is 3.3541. (See how we get the F-TABLE in SQL)
select
Flavor,
count(value) [COUNT],
sum(value) [SUM],
avg(value) [Mean],
cast(var(value) as numeric(9,2)) [Variance]

from [ANOVA].[Flavor_Unpivot]
group by Flavor
Select *
Into [ANOVA].[Result]
From
(
-- SSB
select
'Between Groups' SOURCE,
sum(power([x_within_bar]- [x_bar],2) * 10) SS,
COUNT(*) - 1 df,
sum(power([x_within_bar]- [x_bar],2) * 10)/ (COUNT(*) - 1) MS
from
(
select
distinct avg(value) over (partition by Flavor) x_within_bar
, avg(value) over () x_bar
from [ANOVA].[Flavor_Unpivot]
) A
UNION ALL
-- SSW
select
'Within Groups' SOURCE,
sum(power((value - x_within_bar),2)) SS ,
count (value) - 3 df,
sum(power((value - x_within_bar),2))/ (count (value) - 3) MS
from
(
select
*
, avg(value) over (partition by Flavor) x_within_bar
from [ANOVA].[Flavor_Unpivot]
) A
UNION ALL
-- SST (all value - mean ) ^ 2
select
'Total' SOURCE,
sum(power((value - x_bar),2)) SS ,
count (value) - 1 df,
sum(power((value - x_bar),2))/ (count (value) - 1) MS
from
(
select
*
, avg(value) over () x_bar
from [ANOVA].[Flavor_Unpivot]
) A
) A;
Declare @MSB NUMERIC(9,2)
Declare @MSW NUMERIC(9,2)
SET @MSB = (Select MS FROM [ANOVA].[Result] WHERE SOURCE = 'Between Groups')
SET @MSW = (Select MS FROM [ANOVA].[Result] WHERE SOURCE = 'Within Groups')

select @MSB/ @MSW
The F for alpha 0.05 is 3.3541. (See how we get the F-TABLE in SQL)
select * from  [FTable].[All]
where Alpha = '0.05' and Df1 = '2' and Df2 = '27'
3.3541 > 2.5146, we can't reject null hypothesis unless we can tolerate higher type 1 error (H0 is rejected even though it is true).
Thanks! Enjoy it:)
Thanks! Enjoy it:)
Comments
Post a Comment